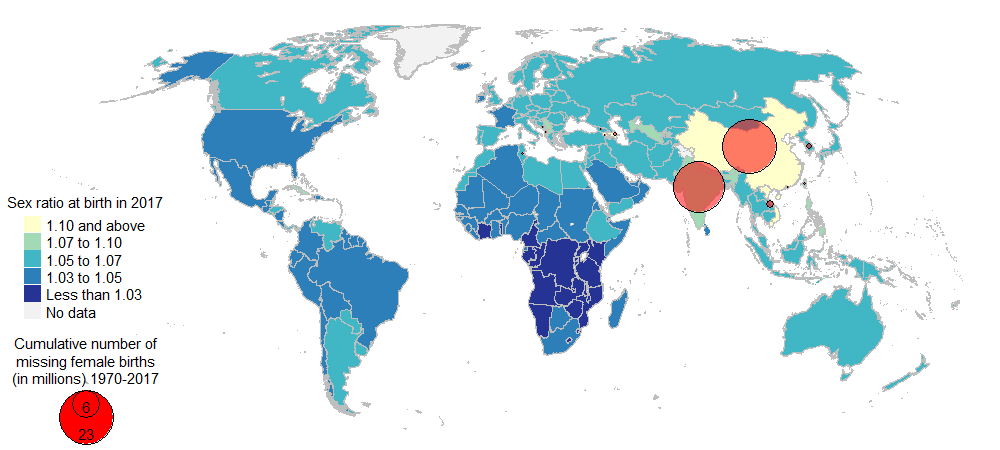
Calculating Missing Female Births

How to calculate female missing births
We believe that the first known computation of missing women is introduced by Dreze and Sen in 1989 in their book Hunger and Public Action, introducing the basic following equation: $$\text{missing births}= B_f^E - B_f,$$ where $B_f^E$ is the expected number of female births, and $B_f$ is the observed number of female births.

In our corrected PNAS paper, we obtain the expected number of female births $B_f^E$ as follows: $$B_f^E = \frac{B_m}{R^E}$$ where $B_m$ is the observed number of male births, and $R^E$ is the expected sex ratio at birth under natural circumstances.
An alternative approach makes use of the total number of observed births (i.e. male plus female births) $B$ instead of the number of observed male births $B_m$ to compute the expected female births: $B_f^{E’} = B/(1+R^E)$. This approach is NOT correct for computing missing female births due to sex selective abortion because it only redistributes the existing births; it does not take account of the net decrease in total birth due to sex selective abortion.
A statistical explanation, based on a toy example
Assume that there are 100 families plan to have 1 baby per family. Let $M_i$ and $F_i$ be the number of male and female births for family $i$ respectively, such that for each family, we have $M_i+F_i=1$. Let $m_i$ be the number of male pregnancies and $f_i$ the number of female pregnancies initiated by family $i$. Let the baseline (i.e. reference level) of the sex ratio at birth be $R^E=1.06$ (i.e., the baseline estimated for China, according to the PNAS paper1). The probability of conceiving a boy, $\pi_b$, is then $$\pi_b = \frac{R^E}{1+R^E} = \frac{1.06}{1+1.06} \approx 0.515.$$ Hence in absense of sex selective abortion, about 51.5 out of 100 families have a boy.
Now assume that a fraction $\theta$ of families aborts any daughters until they get a son. Then for such families the number of aborted females follows a geometric distribution $\mathcal{G} (\pi_b)$ with mean $$\frac{\pi_g}{\pi_b} = \frac{1-\pi_b}{\pi_b} = \frac{1-0.515}{0.515} \approx 0.943,$$ where $\pi_g=1-\pi_b$. Hence, each such family has lost an average of 0.943 female births.
Among the 100 families, the fraction of families that have a boy is: $$Pr(M_i=1)=\pi_b (1-\theta)+\theta = p_b.$$ $p_b$, the actual proportion of male births among all births in a population follows directly from the observed sex ratio at birth. Suppose this observed sex ratio at birth is 1.20, i.e. 120 male births for every 100 female births, then we have $$p_b = \frac{R}{1+R} = \frac{1.2}{1+1.2} \approx 0.545.$$
Given the values of $\pi_b$ and $p_b$, we can solve $\theta$, here $\theta \approx 0.064$. The number of aborted baby girls due to the desire for a baby boy for our example is then equal to the product of $\theta$, the mean number of aborted female births for a family that desires a boy, and the total number of families: $$\theta \cdot \frac{\pi_g}{\pi_b} \cdot 100 \approx 0.064 \times 0.943 \times 100 \approx 6.$$ Hence, 100 births that the 100 families have had are in fact the result of roughly 106 pregnancies, out of which 6 have been aborted.
We end up with the same result by using the direct approach to compute the number of missing female births:
$$B_f^E = 54.5 / 1.06 = 51.4 \\\
B_f = 100 - 54.5 = 45.5 \\\
B_f^* = 51.4 - 45.5 \approx 6.$$
-
Chao, F., Gerland, P., Cook, A. R., & Alkema, L. (2019). Systematic assessment of the sex ratio at birth for all countries and estimation of national imbalances and regional reference levels. Proceedings of the National Academy of Sciences, 116(19), 9303–9311. ↩︎